Technical Analysis for Beginners 2026: Simple Guide to Read Stock Charts
Disclaimer: This article is only for educational purposes. I am not a financial advisor. Trading and investing involve risk, and you can lose money in the market. Always do your own research before trading.
📚 Table of Contents
- Introduction
- What Is Technical Analysis?
- Why Technical Analysis Matters
- Understanding Market Trends
- Support and Resistance
- Candlestick Patterns
- Importance of Volume
- Popular Trading Indicators
- Real Beginner Mistakes
- Beginner Trading Tips
- Pros and Cons
- FAQ
- Final Thoughts
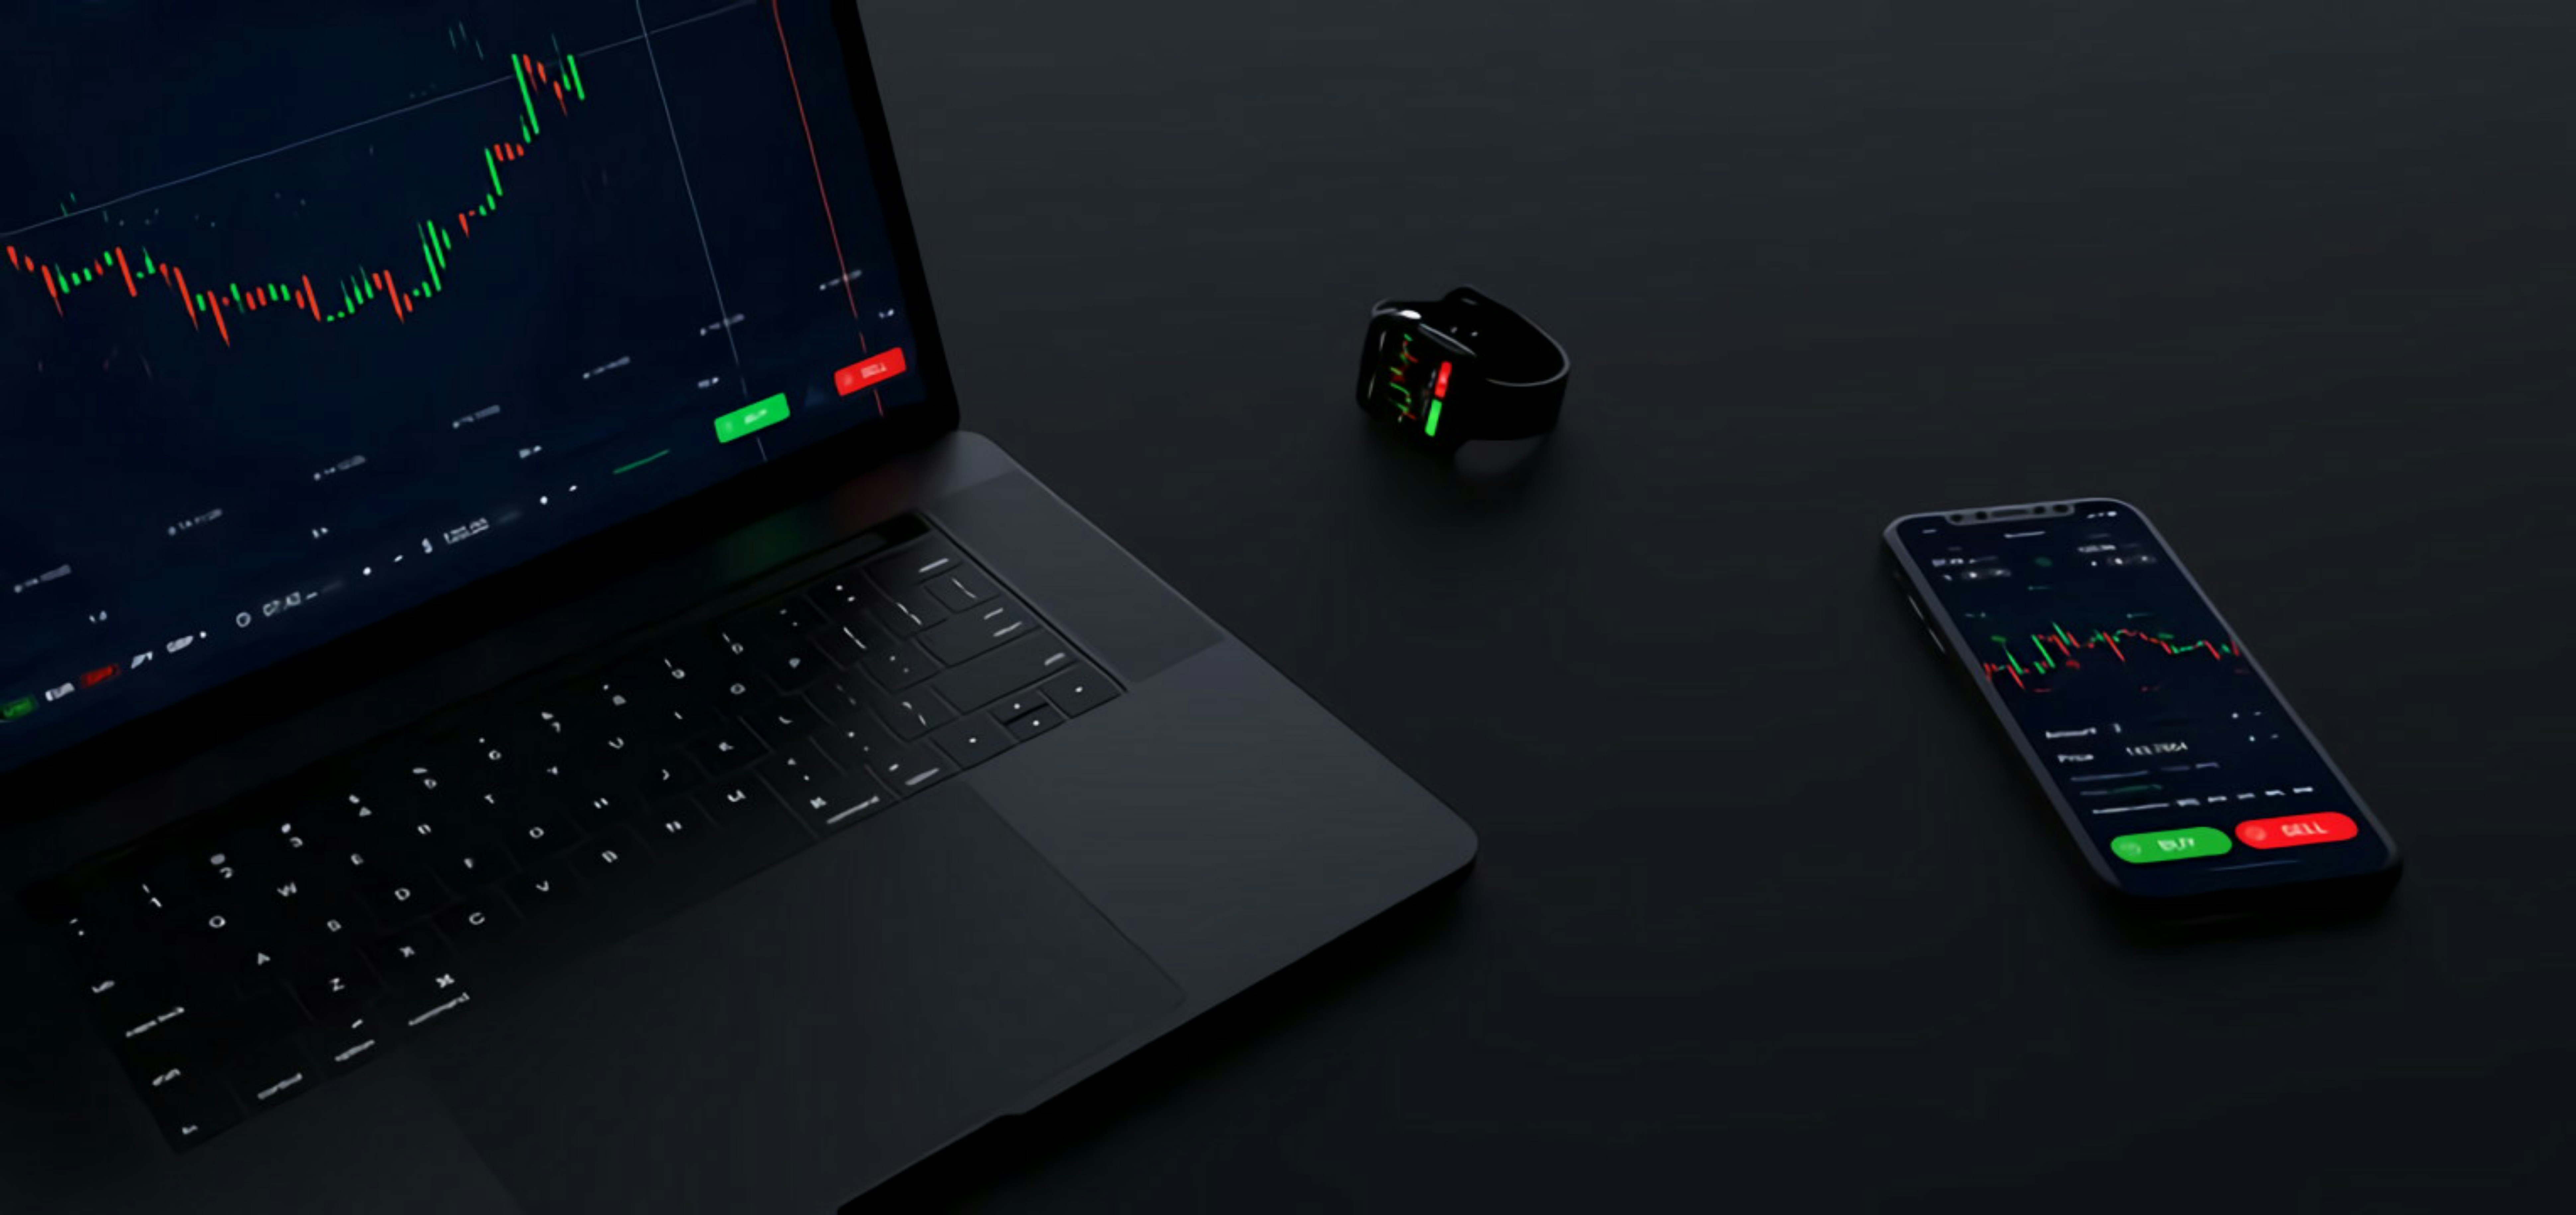
📈 Introduction
When I first looked at a stock chart, honestly, I understood nothing. The candles, lines, indicators, and moving prices looked very confusing.
I used to think only expert traders or finance professionals could understand technical analysis. But after learning slowly and practicing every day, I realized technical analysis is actually much simpler than people make it look.
In simple words, technical analysis means studying price charts to understand possible future market movements.
It helps traders find better buying and selling opportunities by studying past price action, trends, and volume.

👉 What Is Technical Analysis?
Technical analysis is a method traders use to study stock charts and market behavior.
Instead of focusing only on company news or financial reports, technical analysis focuses mainly on:
- Price movement
- Trading volume
- Chart patterns
- Market trends
The main goal is to understand market psychology and possible future price direction.
💡 Why Technical Analysis Matters
Many beginners enter trades without any proper plan. They buy stocks only because someone on YouTube, Telegram, or social media recommended them.
Honestly, I also made this mistake in the beginning.
Technical analysis helps traders make more informed decisions instead of emotional decisions.
It can help you:
- Find better entry points
- Identify trends
- Manage risk
- Avoid emotional trading
- Understand market behavior

📊 Understanding Market Trends
One of the first things beginners should learn is market trend direction.
🟢 Uptrend
An uptrend happens when prices continue moving higher.
Buyers are stronger than sellers during this phase.
🔴 Downtrend
A downtrend happens when prices continue falling.
Fear increases and sellers control the market.
⚪ Sideways Market
Sometimes the market moves within a fixed range without clear direction.
This market condition often confuses beginners.
🧱 Support and Resistance Explained Simply
Support and resistance are some of the most important concepts in technical analysis.
- Support: A price area where buyers usually enter and stop prices from falling further.
- Resistance: A price area where sellers usually become active and stop prices from rising further.
I personally use support and resistance levels more than complicated indicators because they help simplify chart reading.
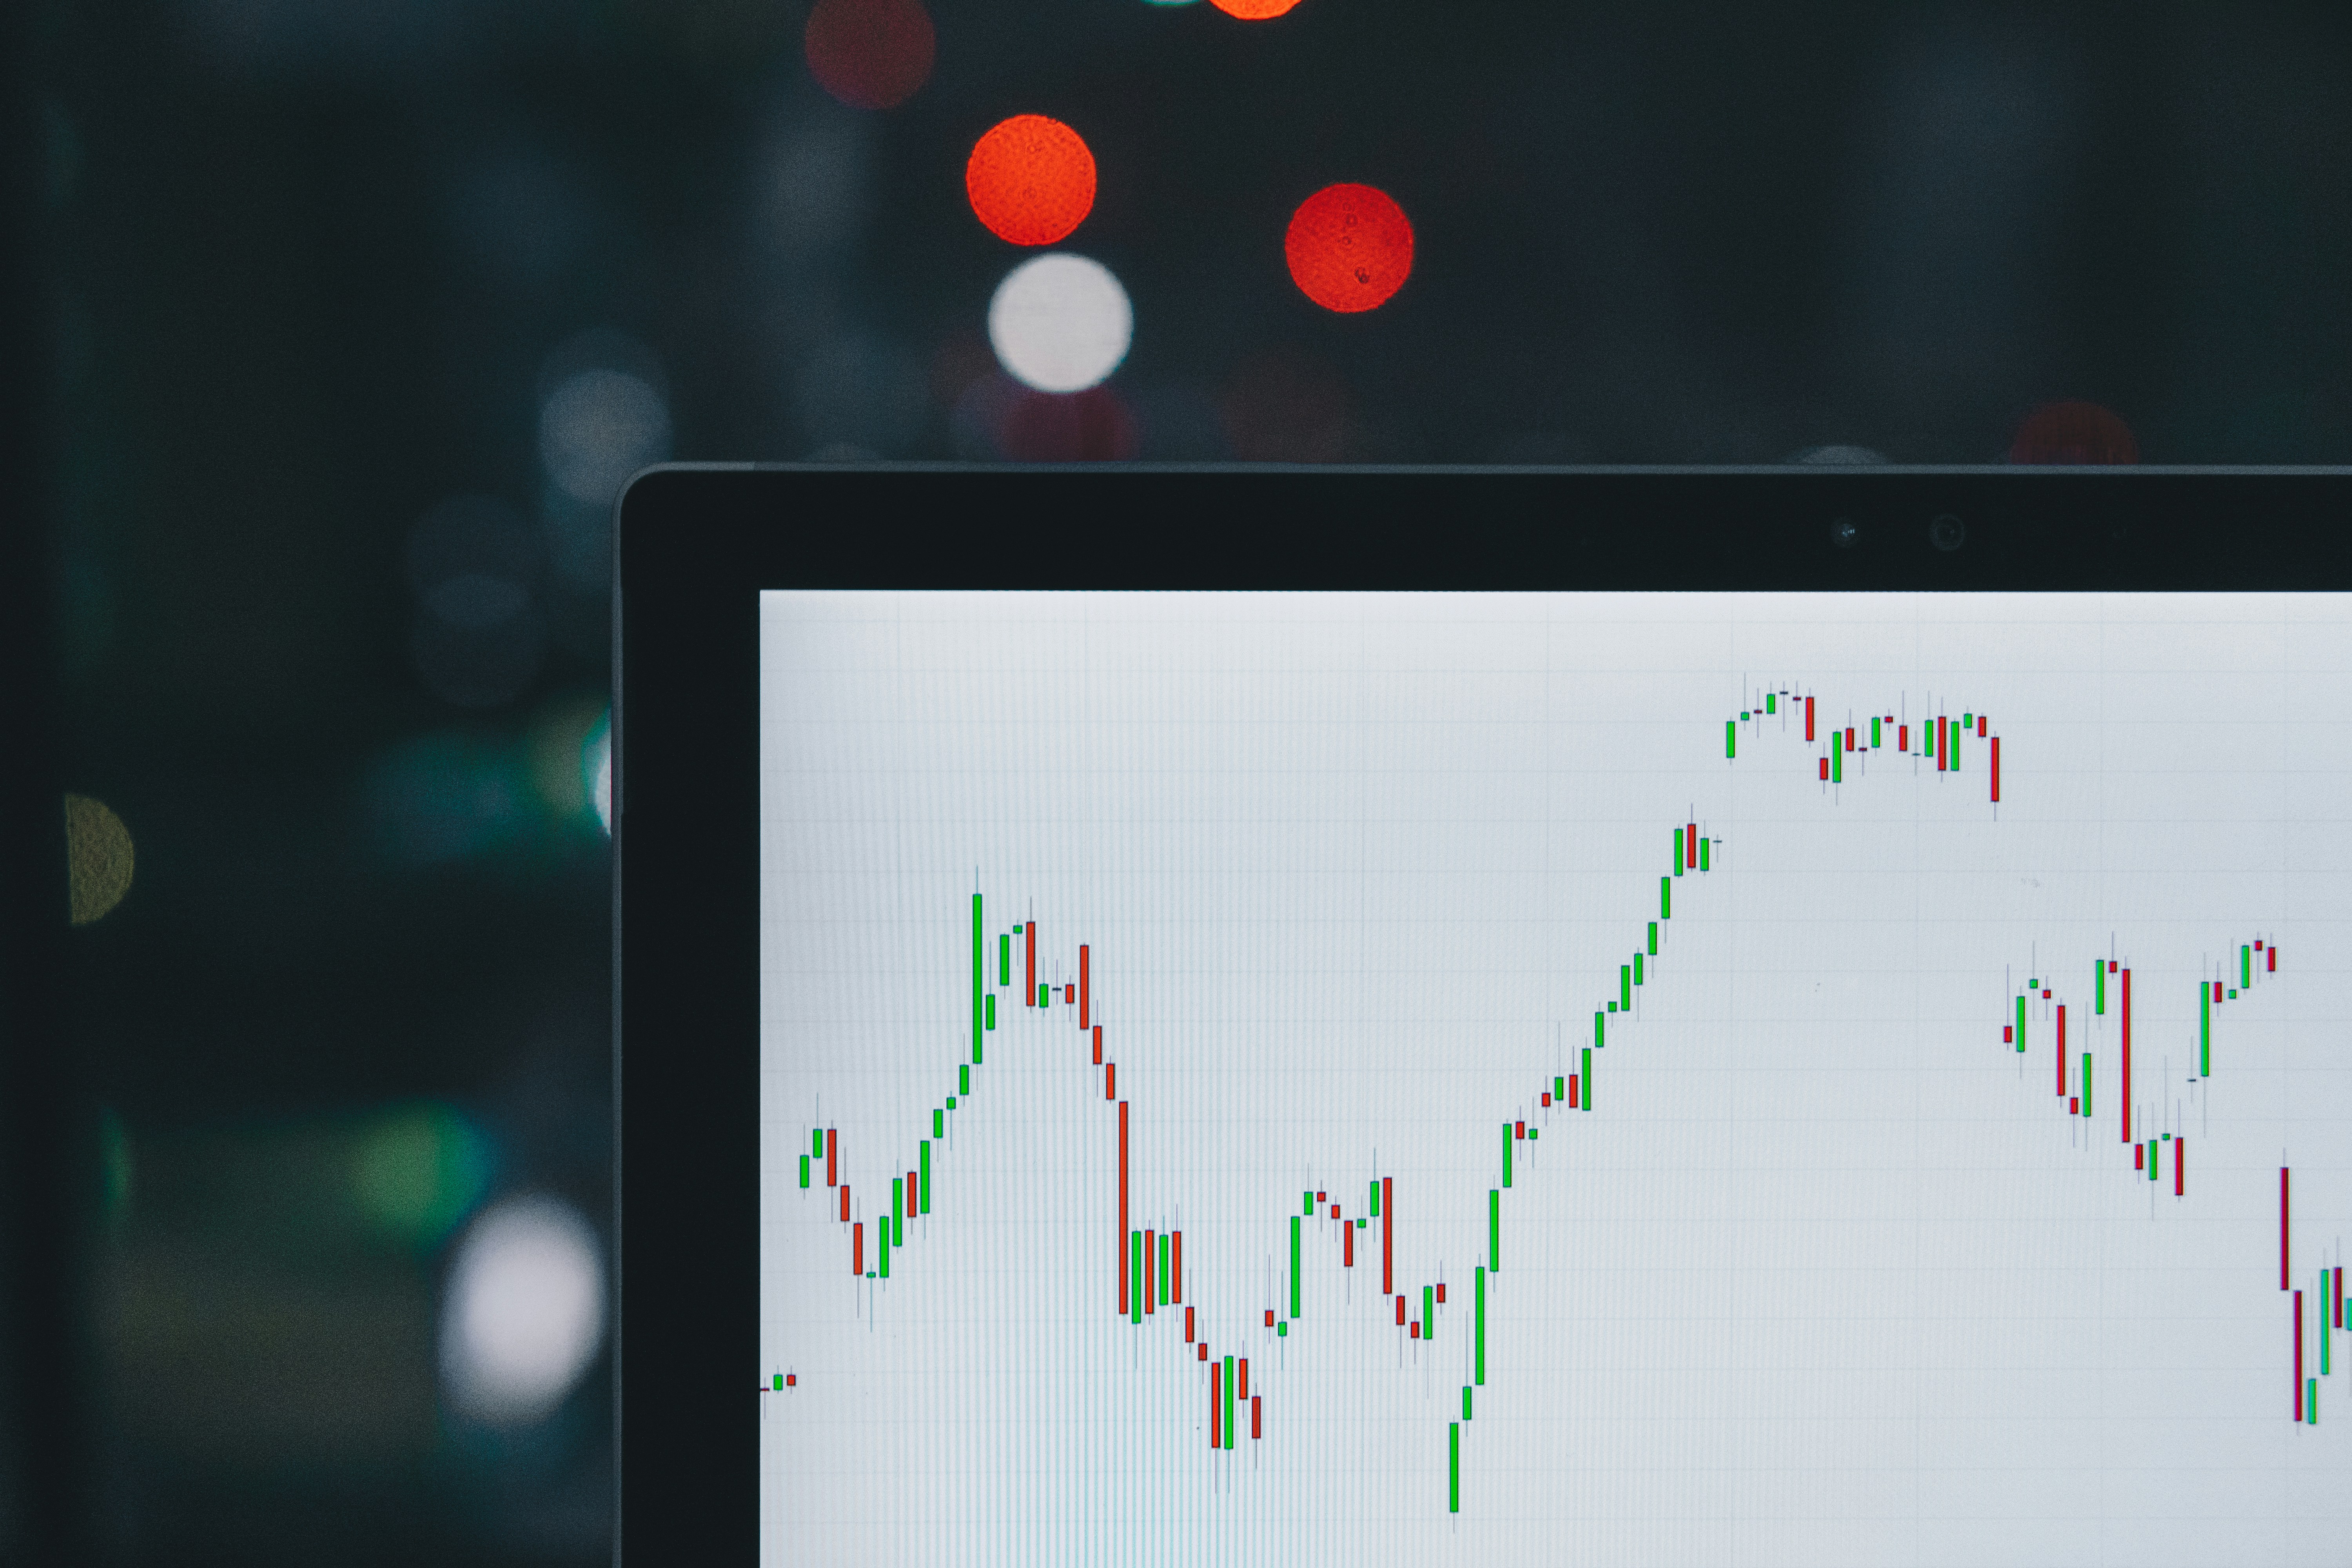
🕯️ Candlestick Patterns for Beginners
Candlestick patterns show market emotions like fear, greed, buying pressure, and selling pressure.
Hammer Candle
A hammer candle usually appears after a market fall and may signal a possible reversal.
Bullish Engulfing
This pattern shows strong buying pressure entering the market.
Doji Candle
A doji candle shows market indecision between buyers and sellers.
Important Tip: Never depend only on one candle pattern. Always combine it with support, resistance, and volume. Know more about candlesticks patterns and how does candlesticks works
📦 Why Volume Is Important
Volume shows how much trading activity is happening in the market.
Strong volume usually means strong market interest.
- High volume breakout can be powerful
- Low volume moves may be weak
- Volume helps confirm trends

📐 Popular Technical Indicators
Many beginners use too many indicators together. Honestly, I also made this mistake before.
Simple charts usually work better.
Moving Average
Helps identify market direction and trend strength.
RSI (Relative Strength Index)
Shows whether a stock may be overbought or oversold.
MACD
Used to identify momentum and possible trend reversals.
❌ Real Beginner Mistakes I Personally Noticed
- Trading without stop loss
- Following social media hype blindly
- Overtrading every day
- Using too many indicators
- Taking emotional trades
- Expecting fast money
In my opinion, emotional control is more important than finding the perfect strategy.
💡 Beginner Trading Tips
- Start with paper trading first
- Focus on learning, not quick profits
- Use proper risk management
- Keep charts clean and simple
- Practice daily chart reading
- Stay patient and disciplined
⚖️ Pros and Cons of Technical Analysis
Pros
- Helps identify market trends
- Improves entry and exit timing
- Useful for risk management
- Works in different markets
Cons
- No strategy is 100% accurate
- Requires practice and patience
- Emotional trading can still cause losses
- Beginners may overcomplicate charts
❓ Frequently Asked Questions (FAQ)
Is technical analysis good for beginners?
Yes. Technical analysis helps beginners understand market trends and price behavior visually.
Can technical analysis guarantee profits?
No. No strategy guarantees profits. Technical analysis only improves probability.
How long does it take to learn technical analysis?
Basic concepts can be learned in a few weeks, but real experience takes time and practice.
Which indicator is best for beginners?
Many beginners start with Moving Averages and RSI because they are simple to understand.
🏁 Final Thoughts
In my opinion, technical analysis is one of the most useful skills traders can learn.
You do not need expensive courses or complicated strategies to start. Simple chart reading, proper risk management, and patience can already make a huge difference.
The biggest lesson I learned is that trading is not about getting rich quickly. It is about staying disciplined, protecting your capital, and improving slowly over time.
If you stay consistent and continue learning every day, technical analysis can become a powerful skill for your trading journey.


No comments:
Post a Comment